Connected Papers
Category AI Office
Published 2026-04-05

Overview

This section highlights the core features, use cases, and supporting notes.

Connected Papers is a visual literature exploration tool for researchers who want to understand how papers cluster around a topic instead of only reading search results one by one. It is most useful when the challenge is mapping a research area quickly and building a better reading path before going deep.

Connected Papers turns academic exploration into a visual map instead of a list of search results. Its value comes from helping users see relationships between papers so they can understand a field’s shape faster.

It suits students, researchers, and applied scientists who are entering a topic, reviewing related work, or trying to trace how important papers connect. The fit becomes strongest when orientation is more important than retrieving one known citation.

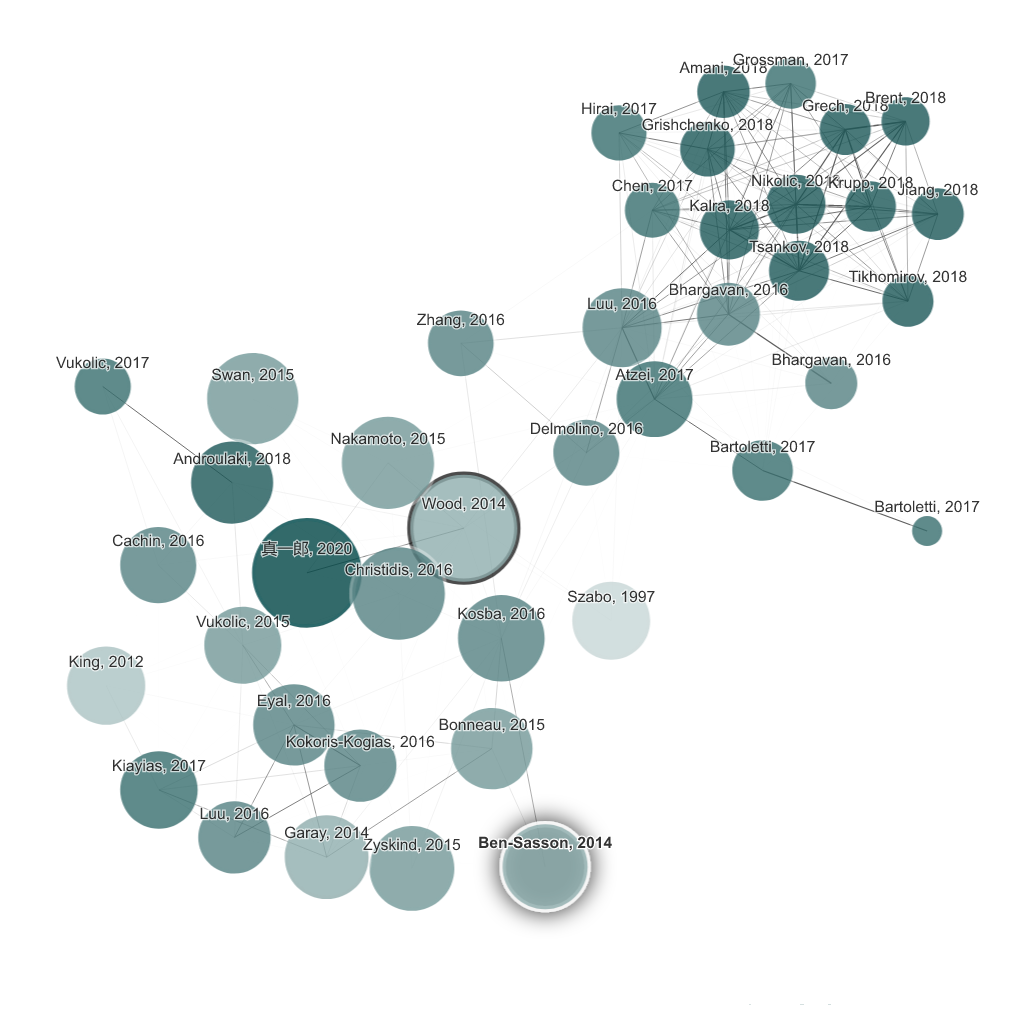
What makes Connected Papers worth attention is that literature review often stalls in the discovery stage. A visual graph can help users move from isolated papers to a clearer sense of which clusters, bridges, and foundational works deserve time first.

The tradeoff is that visual proximity still does not prove methodological quality or direct relevance to your exact question. The graph is a navigation aid, not a substitute for reading and evaluating the actual papers.

This site recommends Connected Papers for researchers who want a faster way to see how a field hangs together. Start from one relevant seed paper, then keep it if the visual map consistently helps you find stronger reading paths than a plain search list.

Setup / Usage Guide

Installation steps, usage guidance, and common notes are maintained here.

  1. Open Connected Papers from the official site and start with one paper that is genuinely relevant to your topic. The graph is only as useful as the seed you choose.
  2. Use the first graph to understand the shape of the field before opening too many papers. The initial value is in orientation, not in immediate downloading.
  3. Look for clusters, bridges, and central papers. Those patterns often reveal where the literature divides or converges.
  4. Open a few papers from different parts of the graph instead of staying in one familiar cluster. This helps reduce tunnel vision early.
  5. Check dates and citation context before assuming importance. A well-connected node is not automatically the right paper for your current question.
  6. Use the graph to build a reading order, not only a bookmark pile. Practical value appears when the tool improves how you study the area.
  7. Pair the graph with your own notes on why each paper matters. Visualization works best when it feeds a real review process.
  8. Keep Connected Papers if it consistently helps you understand topic structure faster than keyword search alone. That is the strongest reason to keep it.

Related Software

Keep exploring similar software and related tools.