
Overview

This section highlights the core features, use cases, and supporting notes.

Libre Hardware Monitor is an open-source Windows hardware monitoring tool for users who want live sensor data without locking themselves into a bundled tuning suite. Its real value comes from temperature, voltage, load, clock, fan, storage, and network sensor visibility, a portable GitHub-based release path, winget install support, and an official library that can also feed custom monitoring projects.

Libre Hardware Monitor is best understood as a lightweight sensor-reading workbench for Windows, not as a full motherboard control suite and not as a flashy gamer dashboard. The official GitHub README says the project can monitor temperature sensors, fan speeds, voltages, load, and clock speeds, and that description is practical because it keeps expectations grounded. This tool is for people who want to inspect what the hardware is doing right now: thermal behavior, clock movement, fan response, voltage readings, storage visibility, and similar system-health clues. For readers searching for a Windows hardware monitor, a CPU and GPU temperature monitor, or a lightweight open-source sensor tool, that positioning is more useful than generic “PC booster” language.


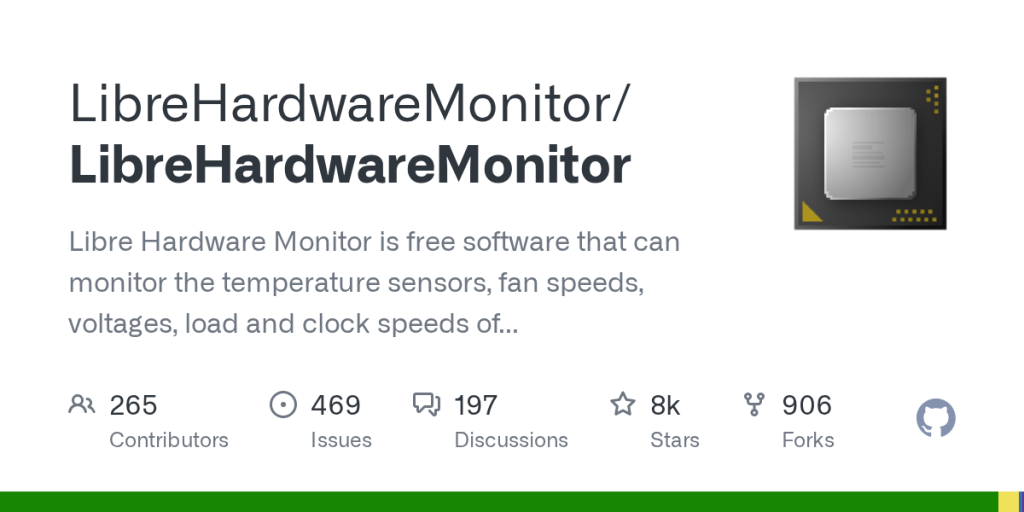
Annotated screenshot of the official Libre Hardware Monitor GitHub overview showing hardware sensor monitoring scope
This overview screenshot matters because the GitHub project page is the real official home, and it immediately tells users what kind of hardware data the tool is designed to expose. Click the image to open the full-size screenshot.

The fit is strongest for PC enthusiasts, troubleshooters, builders, support staff, home lab users, and anyone who wants evidence before changing fan curves, repasting hardware, blaming a game, or suspecting storage trouble. Libre Hardware Monitor is less suitable for readers who expect full RGB, overclocking, or vendor-control features from the same app. This page lowers expectations on purpose: monitoring and control are not the same thing. Libre Hardware Monitor earns its place when the first need is visibility.

The official README also makes an important distinction in the “What’s included?” section: this project is both a Windows Forms application and a reusable library. That is a real differentiator. Some readers only need the desktop program. Others may want hardware metrics inside a custom tool, dashboard, exporter, or automation workflow. This dual role makes the project more durable than a one-purpose GUI-only utility, and it is one of the clearest reasons to recommend it for practical Windows monitoring work.


Annotated screenshot of the official Libre Hardware Monitor README table showing both the Windows application and reusable library
The included-components screenshot adds decision value because it shows this project is not only a desktop app. It can also serve developers who want the sensor library in their own tools. Click the image to open the full-size screenshot.

The supported-device list is another reason the project is easy to judge honestly. The README says it can read information from motherboards, Intel and AMD processors, NVIDIA, AMD and Intel graphics cards, HDD, SSD and NVMe drives, and network cards. That is broad enough to be genuinely useful, but not so broad that the page should pretend every motherboard or sensor will behave identically. The same README invites users to report inaccuracies because hardware reading differs across manufacturers. That is the right tone. It tells readers both why the tool is useful and why some caution is sensible.


Annotated screenshot of the official Libre Hardware Monitor README hardware coverage list for motherboards processors graphics cards storage and network hardware
This supported-hardware screenshot is useful because it helps users decide quickly whether Libre Hardware Monitor fits the hardware categories they actually need to inspect. Click the image to open the full-size screenshot.

The official download path is also refreshingly simple. The README points users to the release page and provides a winget install LibreHardwareMonitor.LibreHardwareMonitor command. That matters because Windows utility pages are often cluttered with mirrors, wrappers, or unrelated installers. Libre Hardware Monitor stays clean here: official GitHub release or winget path. For a monitoring tool that some users will keep in a maintenance toolkit, that directness is valuable.


Annotated screenshot of the official Libre Hardware Monitor README download section showing release download and winget installation path
The download screenshot matters because it points users to the real official paths instead of low-trust mirrors: GitHub releases and winget. Click the image to open the full-size screenshot.

Nightly builds are also documented, and that is a useful sign of project maturity. At the same time, this page should not treat nightly builds as the default recommendation. They are better viewed as a fallback when a hardware fix or recent change matters more than stability. For most readers, the official stable release is still the sensible first choice, and the existence of nightly builds is better understood as a support path for edge cases and fast-moving hardware support.


Annotated screenshot of the official Libre Hardware Monitor README nightly builds section showing stable and nightly project paths
The nightly-builds screenshot adds value because it helps users understand when to prefer the stable release and when newer test builds might actually be justified. Click the image to open the full-size screenshot.

The latest official release visible on the GitHub releases page was v0.9.6, published on February 14, 2026, when checked on April 13, 2026. That kind of verification matters for monitoring tools because hardware support changes over time. The release notes also show how much of the project’s work goes into board support, sensor corrections, and newer components. That gives readers a better basis for trust than vague claims about being “updated regularly.”


Annotated screenshot of the official Libre Hardware Monitor releases page showing v0.9.6 as the latest verified release
The releases screenshot is valuable because it verifies the latest official version from the source project itself instead of relying on reposted software catalogs. Click the image to open the full-size screenshot.

The developer-information section raises the ceiling of the project even more. The official README includes sample code and explains how to use the library in another application, including enabling CPU, GPU, memory, motherboard, controller, network, and storage categories. That matters for readers who build dashboards, exporters, or internal support tools. Libre Hardware Monitor is not only for watching a desktop tree view. It can also be part of a larger monitoring workflow if that is actually needed.


Annotated screenshot of the official Libre Hardware Monitor developer information and sample code for library integration
This developer-information screenshot matters because it shows the project can feed custom monitoring tools too, not just its own desktop application. Click the image to open the full-size screenshot.

Two more official notes are worth keeping in mind. First, the README says some sensors require administrator rights. That is a practical caution, because missing values do not always mean the tool is broken. Second, the project explicitly warns users to avoid librehardwaremonitor.com because it is not affiliated with the project. That is a rare and very useful warning. Our grounded judgment is that Libre Hardware Monitor is most worth installing for users who want trustworthy hardware visibility with a clean official release path and honest expectations about compatibility. It is less suitable for readers looking for a control suite or one app that handles every vendor-specific tuning task.



Annotated screenshot of the official Libre Hardware Monitor warning about the misleading unofficial librehardwaremonitor dot com domain
The warning screenshot deserves space because it protects users from a misleading unofficial domain and keeps the download path tied to the real project source. Click the image to open the full-size screenshot.

Setup / Usage Guide

Installation steps, usage guidance, and common notes are maintained here.

The safest way to start with Libre Hardware Monitor is to use it as a visibility tool first. Do not begin by chasing the most dramatic number on screen. Open it, identify the hardware categories you care about, and compare the readings against a real task such as idle, gaming, compiling, rendering, or a file-copy workload.

  1. Start from the official GitHub project page only. From there, either download the latest release or use the winget command shown in the README. Avoid unofficial repost sites, especially because the project explicitly warns about a misleading unrelated domain.
  2. If you want the most stable first experience, use the official release page rather than a nightly build. Reserve nightly builds for cases where you need newer hardware support or a recently fixed sensor issue.
  3. Launch the application and identify the hardware categories you actually care about first: CPU, GPU, motherboard, storage, network, or fans. A monitoring tool becomes much easier to read when you have a question in mind.
  4. If expected sensor values are missing, rerun with administrator rights before assuming the software failed. The official README specifically notes that some sensors require admin privileges.
  5. Check idle readings first. This gives you a baseline for temperatures, fan speeds, loads, and clocks before a heavier task begins. Baselines are what make later spikes meaningful.
  6. Run one real workload next, such as a game, stress test, compile, media export, or file copy, depending on what the machine actually does. Then compare how the sensor tree changes under real conditions instead of synthetic guessing.
  7. Watch for patterns instead of obsessing over one value. Rising temperatures together with fan response, clock changes, and system load usually tell a more useful story than a single isolated reading.
  8. If storage behavior matters, pay attention to HDD, SSD, or NVMe visibility as shown in the project's supported-device list. For troubleshooting, storage temperatures and activity can be more revealing than users expect.
  9. If network activity matters, verify whether your network hardware appears and treat that as an extra monitoring layer, not the whole reason to use the program.
  10. Use the official release notes when sensor support seems inconsistent on newer boards or devices. The project evolves heavily around board support and hardware-specific fixes, so release cadence genuinely matters here.
  11. If the software is useful enough to keep, choose whether it belongs as a regular desktop utility or just inside a troubleshooting toolkit. A portable release path makes both styles reasonable.
  12. For developers or advanced users, review the library section only after the desktop workflow already makes sense. The API is powerful, but it is better learned after you understand what readings you actually want.
  13. If you build your own tool with the library, start with only the hardware categories you need. The official sample code enables multiple groups, but real projects should stay as narrow as the use case allows.
  14. When numbers look surprising, compare them across time and context before reacting. Monitoring is most useful when it guides diagnosis, not when it encourages panic over one instantaneous reading.
  15. After a few sessions, decide whether Libre Hardware Monitor solved a real visibility problem. If it consistently helps you inspect thermals, clocks, fan behavior, or storage health, it earns a place. If you actually needed vendor tuning controls instead, choose a different class of tool.

A practical long-term Libre Hardware Monitor setup usually looks like this: official GitHub release or winget only, stable release first, administrator rights used when needed, baseline idle readings before heavy workloads, interpretation based on patterns rather than one number, release notes checked when hardware support is uncertain, and the library used only when a custom integration really adds value. That keeps the tool clear, honest, and useful over time.

Related Software

Keep exploring similar software and related tools.